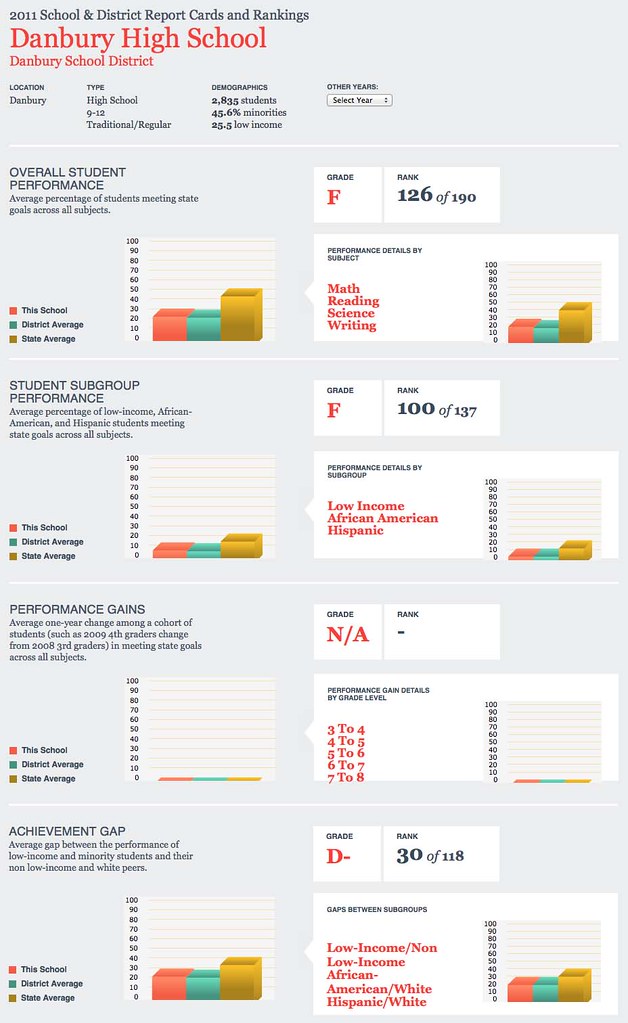
It's that time of the year again as the 2011 school report cards from The Connecticut Coalition for Achievement Now (ConnCAN) were released today. When it comes to Danbury High, as in 2009 and 2010 ConnCAN gave the school a failing grade for it's overall school performance with only 30 percent of students meeting the state goals across all subjects.

Here's a breakdown of ConnCAN's report:
ConnCAN's School Report Cards assign letter grades to over 1,000 Connecticut public schools and 160 school districts based on their students’ achievement in four categories. The report cards are designed to help Connecticut families access information about their local schools and serve as effective advocates for their children. The report cards are also designed to create transparency and awareness about how our public schools perform. Connecticut residents deserve to know how well their public schools are meeting the needs of every student.
Each school and district profile offers descriptive information (such as grade levels, school type, school size, and student demographics) that was obtained from the Connecticut State Department of Education’s website. Each school and district profile also provides student performance data that is based on the 2011 Connecticut Mastery Test for grades three through eight and the 2011 Connecticut Academic Performance Test for grade 10.
Methodology of ConnCAN’s School and District Report Cards
About Connecticut Student Achievement Data
Each year, Connecticut administers two standardized tests, the Connecticut Mastery Test (CMT) and the Connecticut Academic Performance Test (CAPT). These tests are designed to measure how well students are achieving on grade-level academic subjects. Both tests are designed and administered by the State Department of Education.
The CONNECTICUT MASTERY TEST (CMT) is administered each spring to all public school students in grades three through eight. The CMT measures how student achievement in the areas of mathematics, reading, and writing compared to the expectations for their grade level. In fifth and eighth grades, science is also tested.
The CONNECTICUT ACADEMIC PERFORMANCE TEST (CAPT) is administered each spring to all public school students in tenth grade. The CAPT measures student achievement in the areas of mathematics, reading, writing, and science compared to the expectations for high school students.
The skills tested on the CMT and CAPT are identified in the Connecticut curriculum framework, and each student’s achievement is compared to a set of established standards for his or her grade in each subject area. There is no “passing” grade on the CMT or the CAPT. Instead, the State of Department of Education sets a “goal” level score for each subject area in every grade tested. The State Department of Education gives each student a raw score (ranging from 100-400 points) and assigns score cut points for each of five levels: Advanced, At Goal, Proficient, Basic, or Below Basic. The State Department of Education reports scores for schools and districts as the percentage of students scoring at one of these levels. According to the State Department of Education, a student scoring at the “Goal” level has the knowledge, skills, and critical thinking abilities that are “reasonable to expect of students” within their grade level.
ConnCAN uses the Goal standard to set the bar for rating schools since it is the state’s best estimate of students meeting or exceeding grade-level expectations. The State Department of Education reports on the percentage of students “At Goal” in the subjects tested (math, reading, writing and science) for schools in which at least 20 students in any given grade completed the CMT or CAPT.
How we calculate achievement scores
ConnCAN’s report cards provide a single score to help readers compare schools and subgroups within those schools. To do so, we calculate a single “Students At or Above Goal Range” by taking that average percentage of students at or above goal across all subject areas on CMT and CAPT. We calculate this score for elementary schools using the results from the fifth-grade test (with fourth-grade results used when an elementary school does not have a fifth grade). For middle schools, we use the results from the eighth-grade test (with the seventh-grade results used when a middle school does not have an eighth grade). For high schools, we use the results from the CAPT, which tests tenth grade students only. To differentiate between elementary and middle schools, ConnCAN classifies K-6 schools as elementary schools, and classifies schools that are called “Middle” or “Intermediate” and serve grades 4-6 or 5-6 as middle schools. In each case, we use the highest grade level available to calculate the school’s grades. Each district is reviewed separately at the elementary, middle, and high school level. These scores provide a straightforward, easy-to-use yardstick on how well schools, on average, meet the needs of students across key subject areas.
Connecticut’s performance on national tests shows that our state has the NATION’S LARGEST ACHIEVEMENT GAP between low-income and middle class students and between African-American and Hispanic students and their white peers. To better understand how well schools and districts are closing this gap, we calculate the results for African-American, Hispanic, and low-income students using the same method we use to calculate a whole school’s performance. For example, African-American student performance at elementary schools is measured by averaging the percentage of fifth-grade African-American students at or above goal across all subject areas.
How we assign grades
To provide families and communities with a clear benchmark for how their child’s school or district performs, we use achievement scores to assign the school a letter grade from A to F. For each school and district we also show how scores compare to district and state averages.
We assign each school and district letter grades in four categories: Overall Student Performance, Student Subgroup Performance, Performance Gains, and Achievement Gap.
Overall Student Performance
Each school and district receives a grade for how well their students perform overall. To determine this grade, we calculate the average percentage of students meeting state goals across all subjects across the highest grade-level tested in a school. We also report subject-specific achievement results. We calculate grades as follows:
Grade for Percentage of Students At/Above Goal
A 90-100
A- 84-89
B+ 78-83
B 72-77
B- 66-71
C+ 60-65
C 54-59
C- 48-53
D+ 42-47
D 36-41
D- 30-35
F <30
Student Subgroup Performance
To help understand how well schools and districts are educating specific groups of students who are generally the most underserved, we break down the average percentage of students meeting state goals across all subjects in a school’s highest tested grade level across the following student groups: African-American, Hispanic, and low-income students. We calculate grades as follows:
Grade for Percentage of Subgroup Students At/Above Goal
A 90-100
A- 84-89
B+ 78-83
B 72-77
B- 66-71
C+ 60-65
C 54-59
C- 48-53
D+ 42-47
D 36-41
D- 30-35
F <30
Performance Gains
To better understand how well schools and districts are helping students make achievement gains from year to year, we provide a grade for performance gains. To calculate this grade for elementary schools, we determine the average change between 2010 third grade and the 2011 fourth grade, and the 2010 fourth grade and the 2011 fifth grade. For middle schools, we calculate the average change between 2010 fifth grade and 2011 sixth grade, the 2010 sixth grade and the 2011 seventh grade, and the 2010 seventh grade and 2011 eighth grade. We use these average changes to calculate a score. A positive score means that the average percentage of students scoring at goal increased during their year in school, while a negative score means the average percentage of students scoring at goal decreased.
Note: We cannot calculate Performance Gains at the school or district level for high schools since the CAPT is administered in tenth grade only.
If a school's score increased, we divide the difference between these scores by the percentage of students not at goal in 2010. Then, we apply following grade scale:
A .24 or more
A- .20 to .23
B+ .16 to .19
B .12 to .15
B- .08 to .11
C+ .04 to .07
C .00 to .03
If a school's score decreased, we divide the difference between these scores by the percentage of students at goal in 2010. Then, we apply following grade scale:
C- -0.1 to -.04
D+ -.05 to -.08
D .09 to -.12
D- -.13 to -.16
F -.17 or more
Schools with an average percentage of students at goal in 2010 of 85 percent or greater receive an N/A. At or above this 85 percent level, the grade scale begins to approach the ceiling of 100, which diminishes its meaningfulness as a measure of improvement. It is important to note that this indicator is most reliable in showing a school’s impact on the change in student achievement if the school’s student population remains stable from year to year. If many students leave or enter a school within a given year (in other words, if student mobility is high), this indicator is less effective in measuring a school’s ability to improve student achievement.
Achievement Gap
To better understand how well schools and districts are closing the achievement gap, we calculate the average gap between the performance of low-income and minority students to their upper-income and white peers. We measure the achievement gap at each school and district (if data were available for relevant subgroups) by subtracting the minority group’s student performance from the majority group’s performance in a school’s highest tested grade level. For example, the Hispanic-white achievement gap is calculated by subtracting the average percentage of Hispanic students meeting the goal level in each subject area from the average percentage of white students meeting the goal level in each subject; if the percentage of Hispanic students at goal is 25% and the percentage of white students at goal is 45%, the gap is 20.
Grade for Achievement Gap Size
A 0-2
A- 3-5
B+ 6-8
B 9-11
B- 12-14
C+ 15-17
C 18-20
C- 21-23
D+ 24-26
D 27-29
D- 29-31
F >31
...more later.


